Exercise 1 - Activity 5
Overview
In this activity, you will create a Data Visualization and add it to the page.
Instructions
-
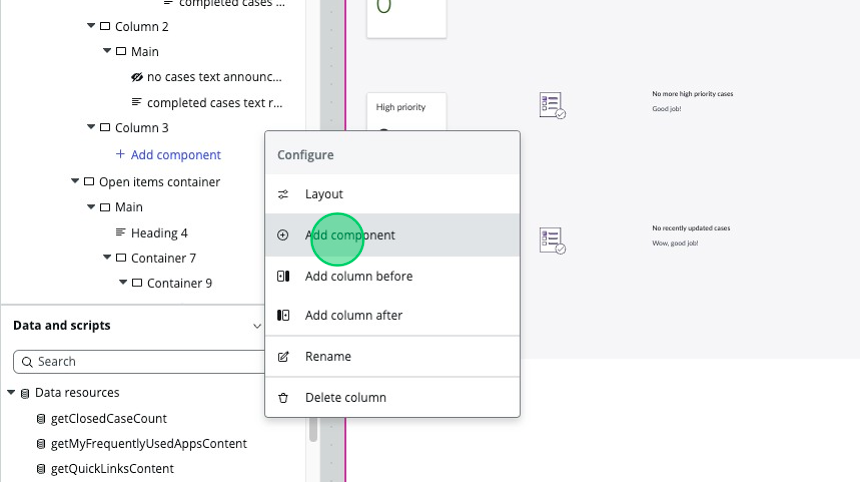
Right click on the "Column 3" component in the component tree.
-
Click Add Component.
-
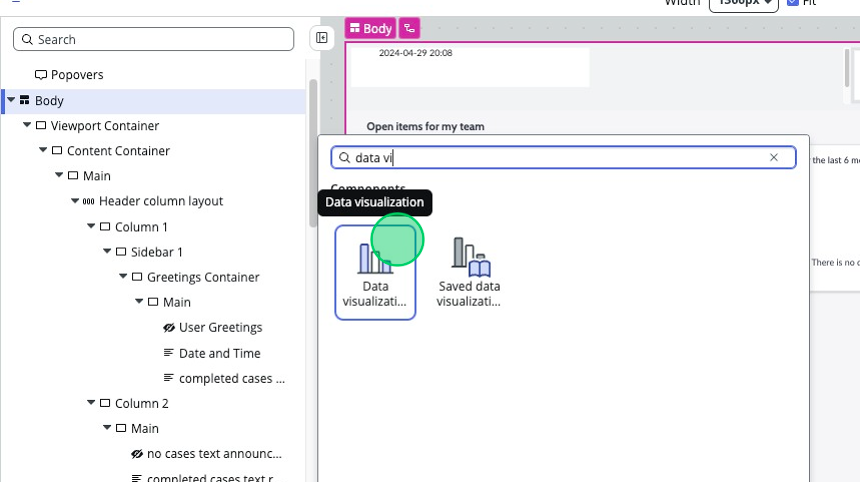
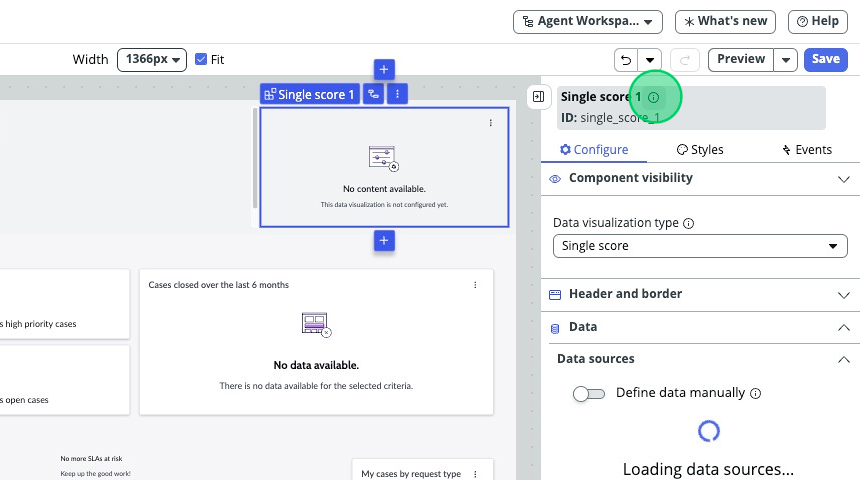
Select the Data Visualization component.
-
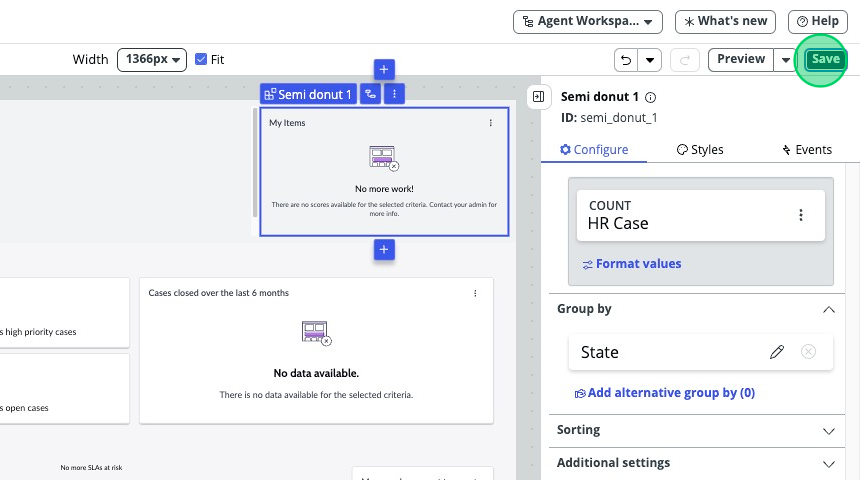
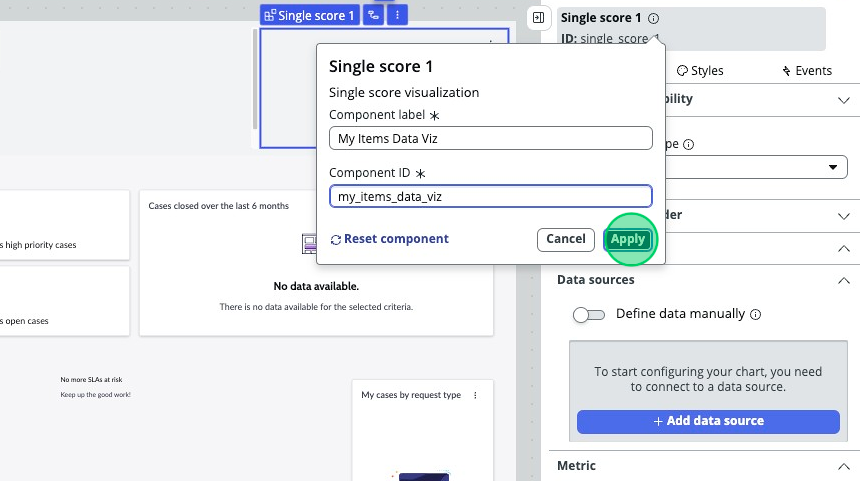
On the right, in the Component Configuration panel, change the name and ID.
- Name: My Items Data Viz
- ID: my_items_data_viz
-
Click Apply.
-
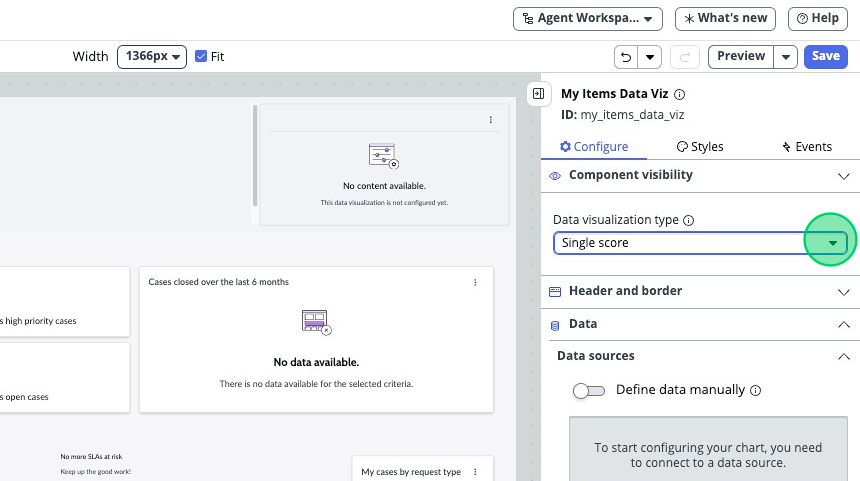
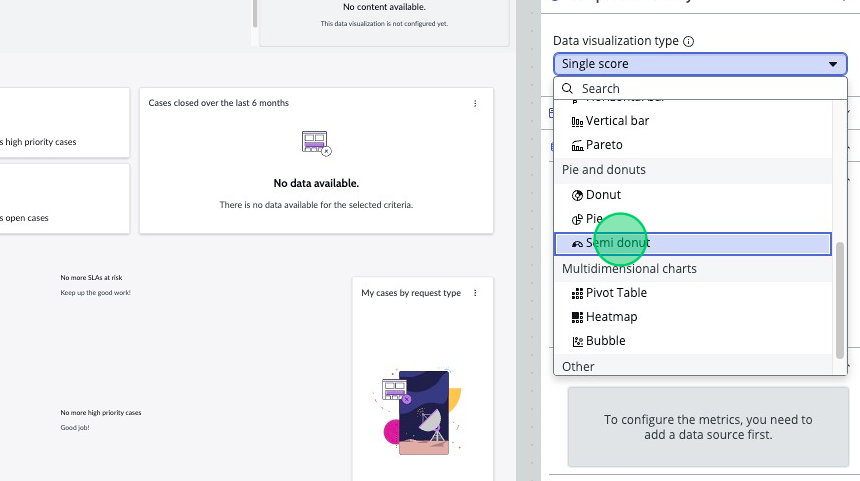
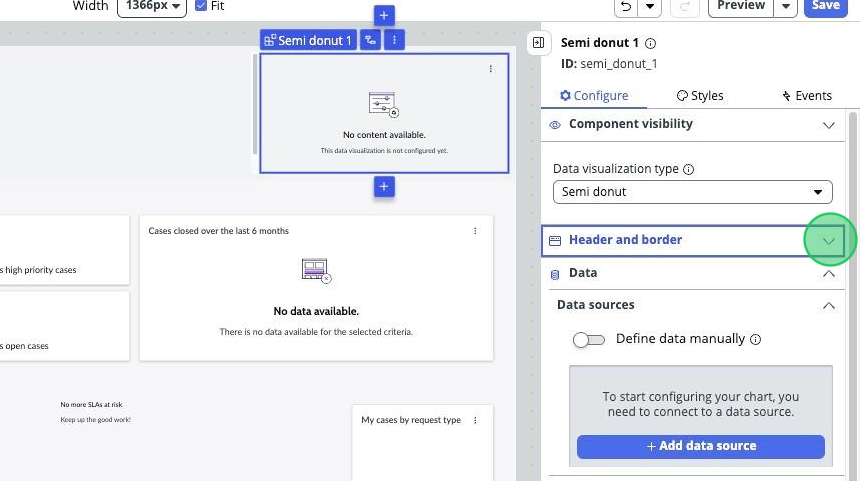
Under "Data visualization type", select Semi Donut from the options provided.
-
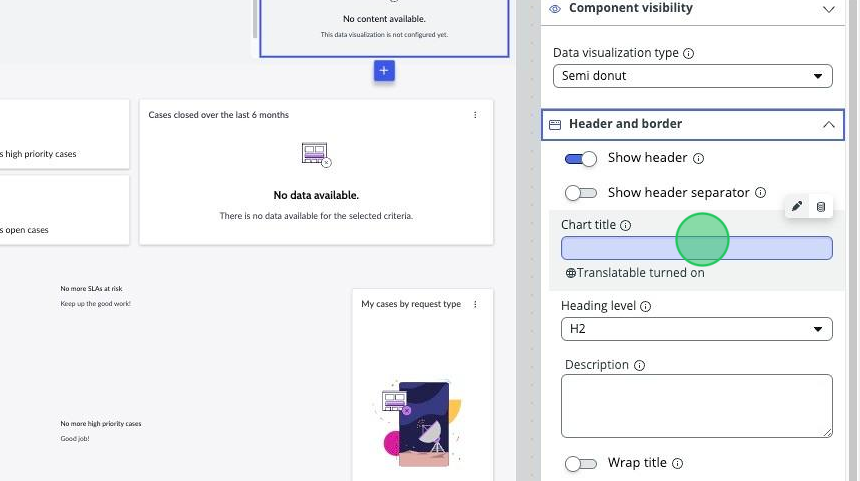
Expand "Header and border" by clicking the down arrow.
-
Set the Chart Title to "My Items".
-
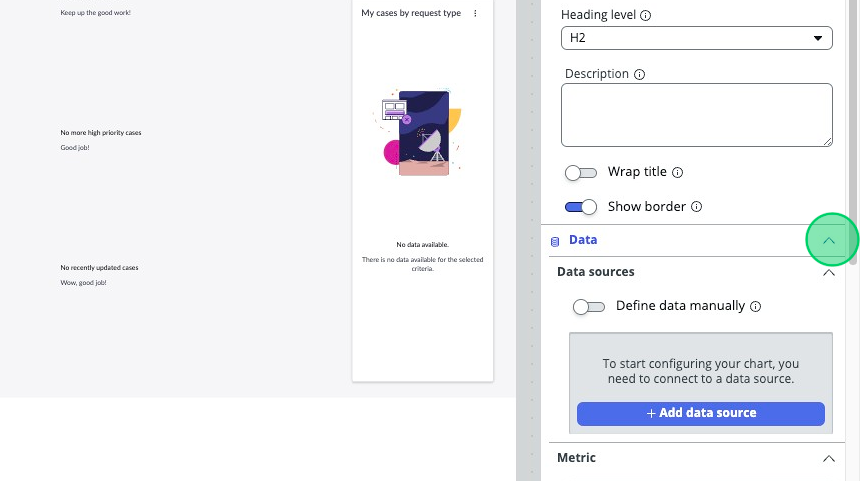
Expand "Data" by clicking the down arrow if it's not already expanded.
-
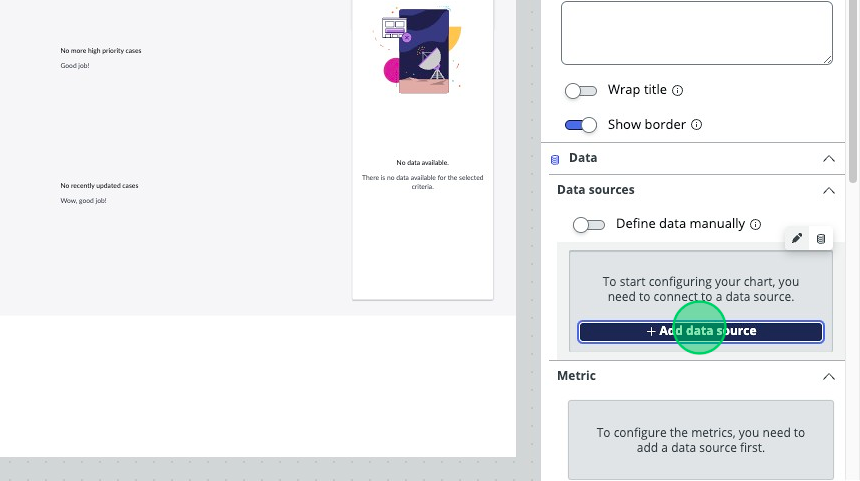
Click the Add a Data Source button.
-
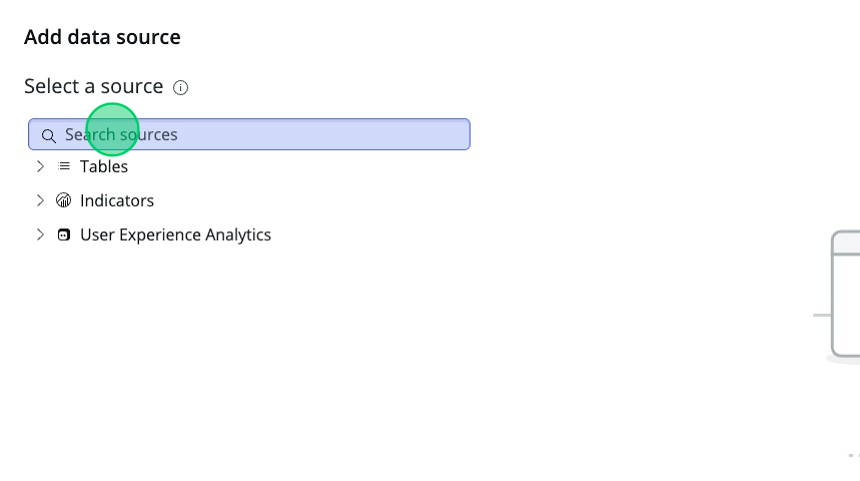
In the top left corner, click on the "Search sources" input box.
-
Type "HR Case".
-
Under the "Tables" category, select
HR Case [sn_hr_core_case].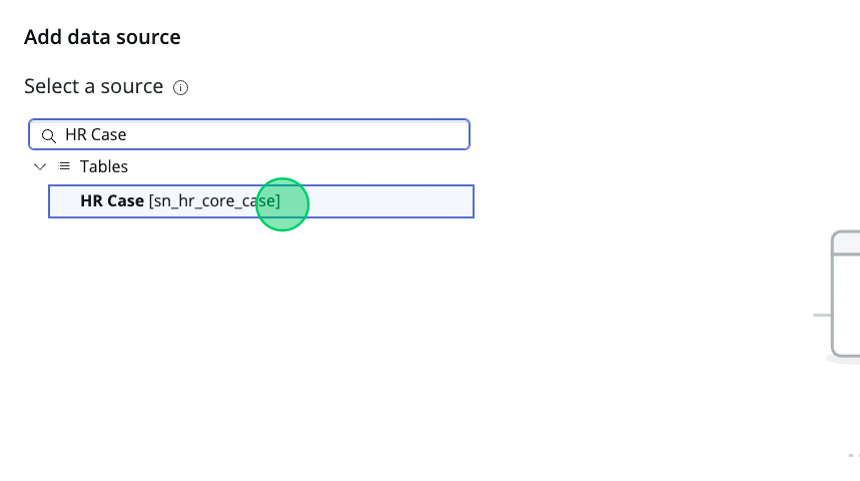
-
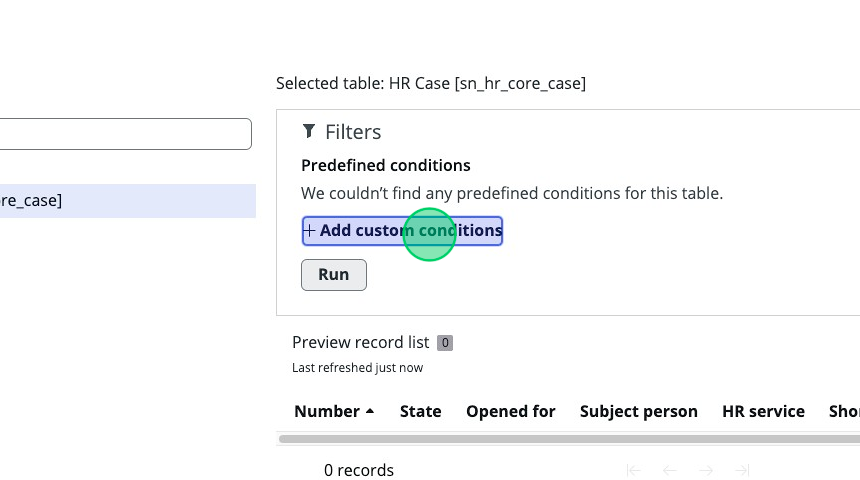
Click Add custom conditions.
-
Fill in the condition editor as follows:
-
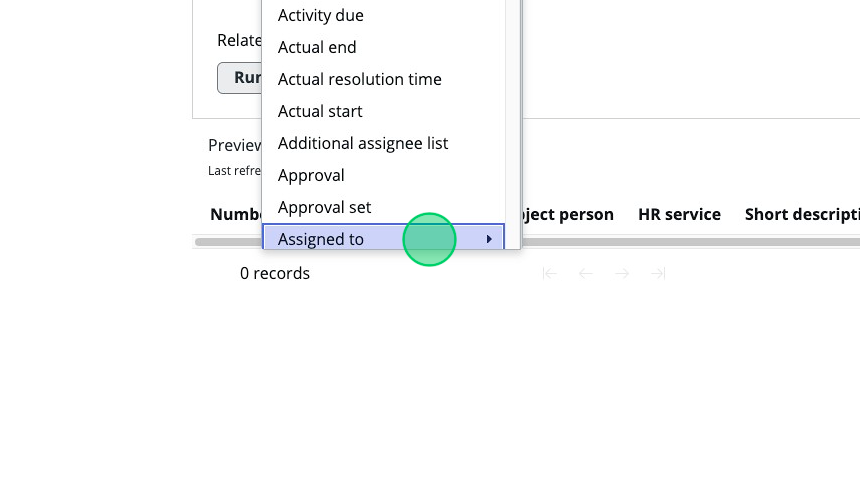
Select Field: Assigned to
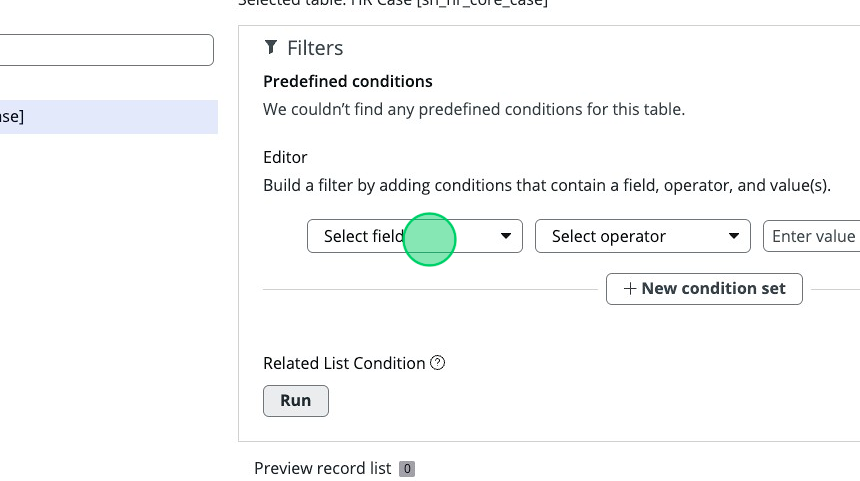
-
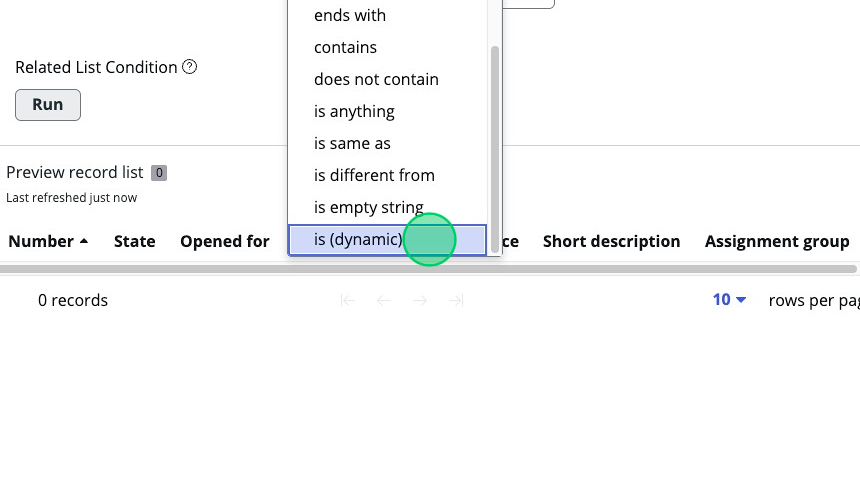
Select Operator: is (dynamic)
-
Enter Value: Me
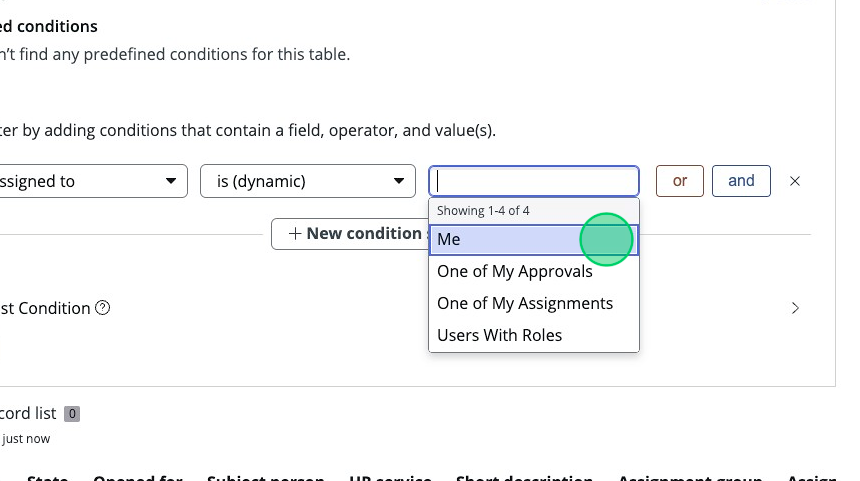
-
-
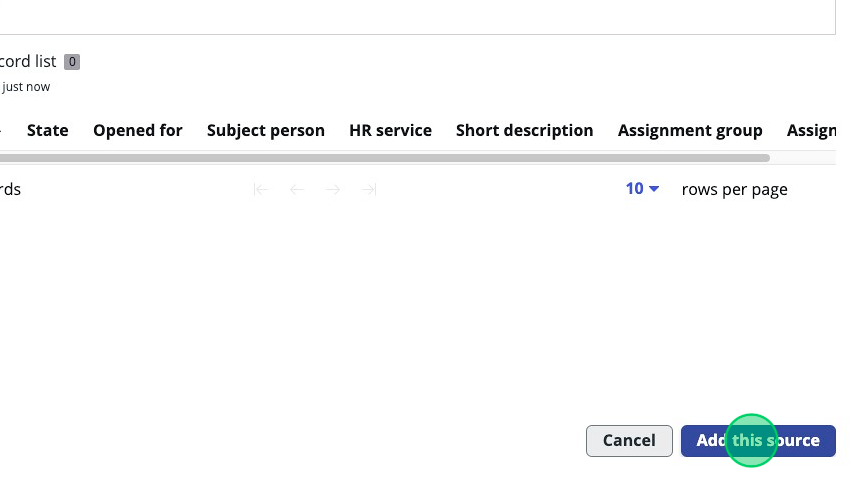
Click Add this source at the bottom right of the page.
-
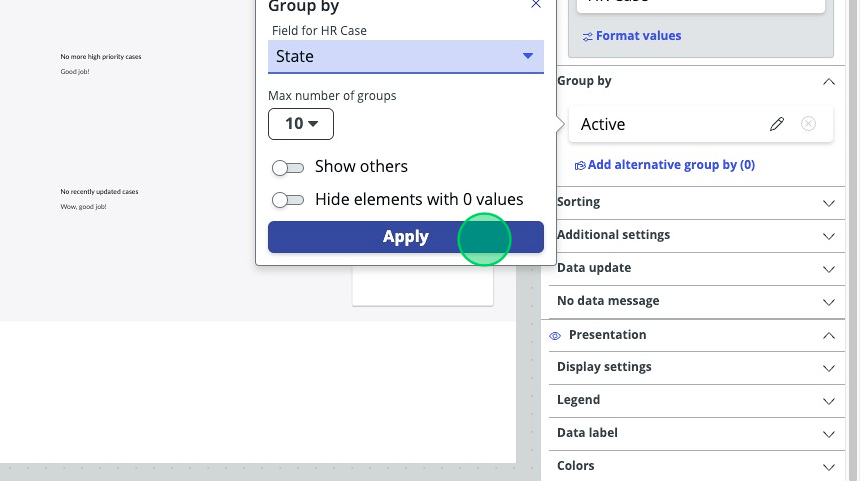
Expand "Group by" by clicking the down arrow if it's not already expanded.
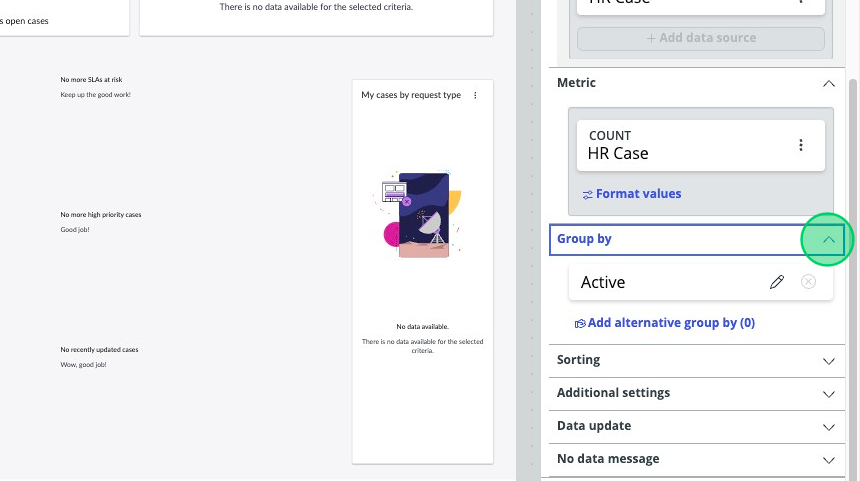
-
Click the pencil icon next to "Active"
-
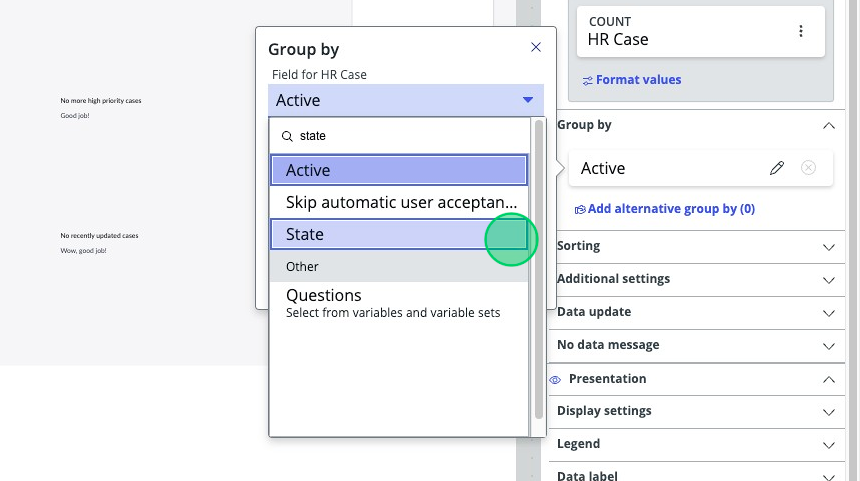
Click the "Field for HR Case" dropdown.
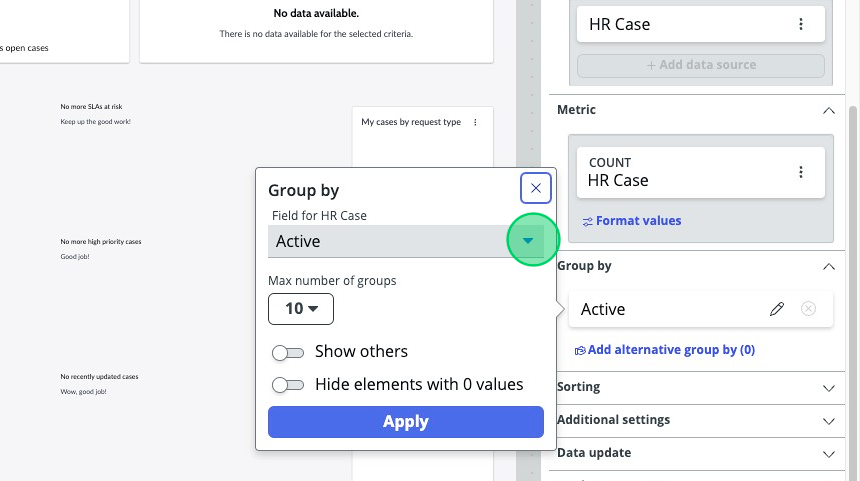
-
Type "State" in the search bar.
-
Click on the State option.
-
Click Apply.
-
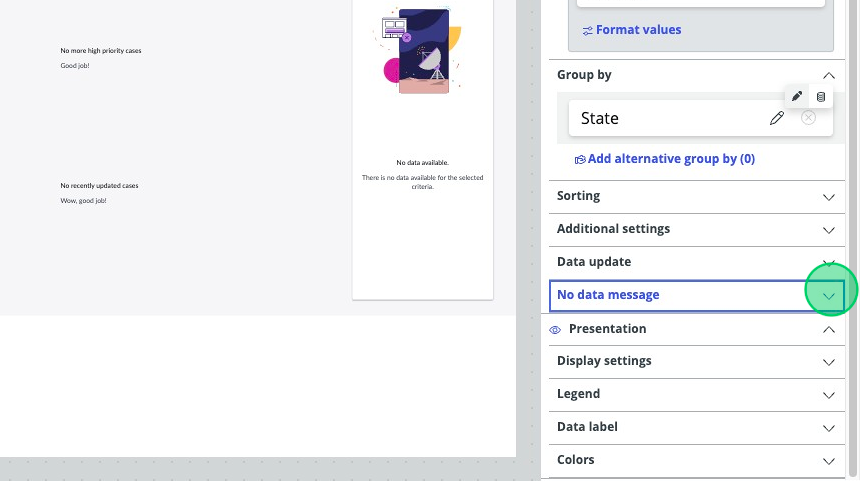
Expand "No data message" by clicking the down arrow.
-
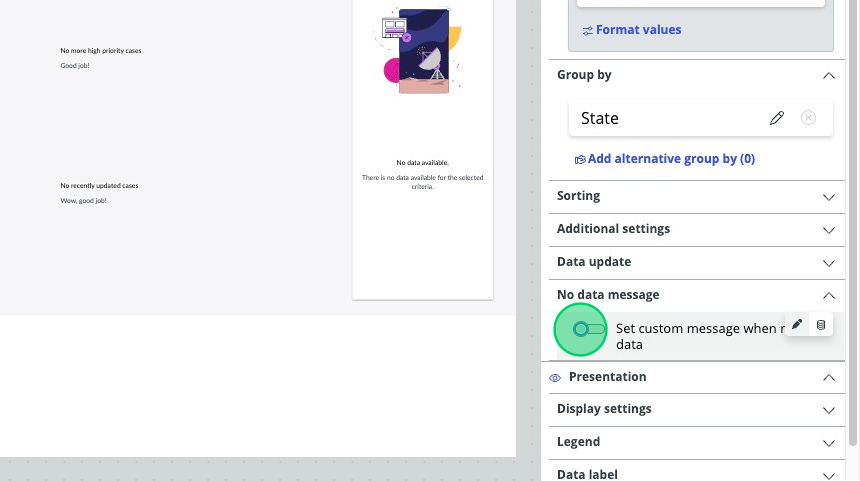
Toggle the "Set custom message when no data" field.
-
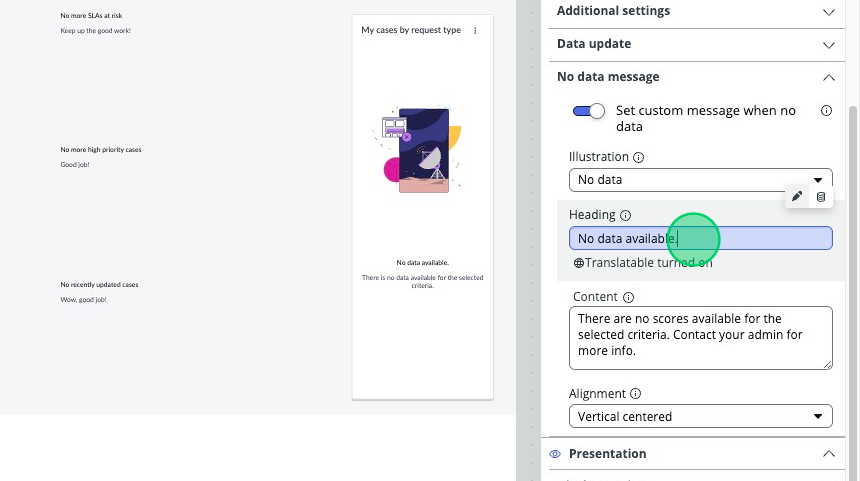
Change the "Heading" to say: "No more work!"
-
Click Save.